Most power plants use some form of condenser performance-monitoring protocol. Some of those protocols are deficient because the proper instrumentation is not installed to collect the necessary data. Three case studies illustrate how collecting good condenser performance data enabled plant staff to troubleshoot problems and make good plant performance improvement decisions.
Visit a hospital, and the doctors seem to have all the latest diagnostic instrumentation and sensors to collect the data necessary to make an intelligent assessment of health problems. Visit the typical power plant, and you’ll likely find it does not have the necessary instrumentation to monitor and collect the data needed to assess equipment health or diagnose nagging problems.
For example, many plants have prepared a condenser performance-monitoring protocol, yet the instrumentation is not available to make a proper diagnosis of condenser performance problems. Use of the correct instrumentation allows a quick, accurate, and economic resolution to condenser problems that are tedious to solve because the failures are often invisible to the plant staff.
The three case studies that follow were selected to demonstrate the importance of having the proper instrumentation in the condenser system. In each case, plant staff had in the past taken great pains to install the necessary instrumentation to evaluate equipment health and kept historical records in the plant’s data historian to assess ongoing performance trends. In each case study, the availability of good data was critical to successfully troubleshooting the problem(s) and in selecting the most economic solution.
Case Study 1: Air Removal
The first case study pertains to an 850-MW-class coal-fired unit that is part of a four-unit plant located in the Midwest. The unit, which entered service in the late 1970s, operates at 3,500 psi, and the steam condenser is a single-pass, two-compartment, low-pressure (LP)/high-pressure (HP) arrangement (the LP cooling water outlet is the HP cooling water inlet).
As is typical of most condensers, a rotameter located on the vacuum pump discharge is used for manual air in-leakage recording. Although this measurement technique may be appropriate for spot-checking, it does not capture real-time data beyond the manual reading an operator may pencil onto a datasheet during rounds. On this unit, air in-leakage is also monitored in real time via the RheoVac system. Specifically, the RheoVac continuously monitors the total mass flow rate, temperature, pressure, and total saturation of the sample stream. From this information, the air in-leakage can be determined. The sensor is installed between the condenser takeoff and the inlet to the vacuum pump.
All data captured by the RheoVac system is automatically sent to the plant historian, which is an OSIsoft PI system. Once the data is entered into the data historian, the air in-leakage data can be trended against all other measured condenser performance parameters.
Prior to implementing the current condenser performance protocol, the staff at the plant did not trust the data produced by the RheoVac system. There was good reason for their skepticism, as the condenser problems experienced at that time all seemed to be the result of tube scaling and fouling. After all, the scaling and fouling were easy to see when the condenser was periodically opened for inspection. Hence, the RheoVac data that showed large amounts of air in-leakage was not taken seriously.
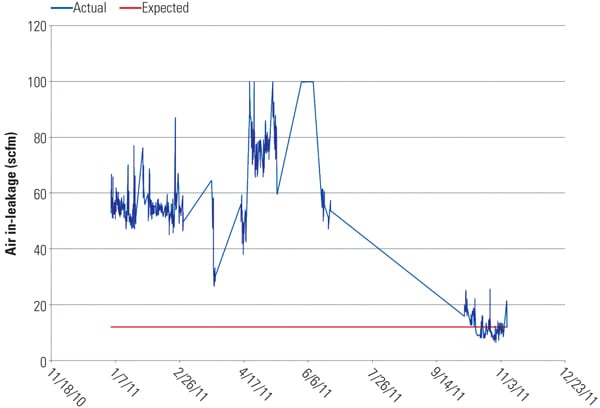
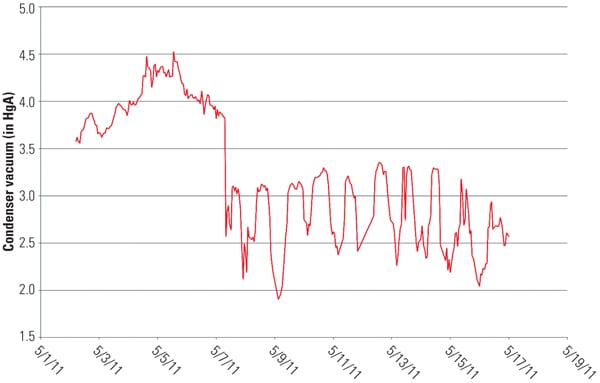
Late in May 2011, the unit scheduled a three-day planned outage during which the LP and HP condensers were opened and the tubes were cleaned by mechanical scraping. Although the condenser performance improved, the condenser did not return to its expected design conditions. Figure 1 illustrates the post-condenser cleaning air in-leakage data in relation to the expected results as of the end of May 2011. Data from the PI historian also showed that the condenser cleanliness factor was slightly improved after mechanical cleaning (Figure 2). Figure 3 shows condenser performance in terms of the large difference between the actual and design condenser backpressure, also measured post-outage. The loss in condenser vacuum translates directly into lowered plant output and reduced unit efficiency.
 |
| 1. Sucking air. Air in-leakage was slightly improved after the condenser was cleaned and minor repairs were completed during a planned outage in late May 2011. Source: Nalco Co. |
 |
| 2. Superficial solution. The condenser cleanliness factor showed little improvement after a mechanical cleaning in late May 2011. Source: Nalco Co. |
 |
| 3. Good vacuum restored. Condenser performance, in terms of the vacuum conditions within the condenser, remained much poorer than design conditions, even after the condenser was mechanically cleaned. Source: Nalco Co. |
As control of the cooling water chemistry improved and the air in-leakage readings were double-checked and confirmed, it soon became clear that the poor condenser performance must be the result of water chemistry problems on the water and steam sides. For this case study, our focus will be on the HP section of the condenser.
The data convinced the plant staff to turn their attention to air in-leakage as the possible cause of poor condenser performance. The plant hired an outside consultant to conduct a condenser air in-leakage inspection. A total of 13 vacuum leaks were identified, with six of the leaks considered a major source of air in-leakage into the condenser. The list below provides examples of the type of leaks found, as well as their severity, based on the surveying company’s standards:
- LP turbine gland seal housing, small
- Boiler feed pump turbine gland seal, medium
- Boiler feed pump turbine shaft seal, medium
- LP turbine bonnet flange below grating, large
- HP turbine valve packing, large
- Spillover valve packing, very large
- Slop drain, very large
- Vacuum pump outside seal, very large
With the leaks identified, the plant manager arranged to have the leaks repaired during an upcoming mini-outage, which took place during the latter part of October 2011. Looking at Figures 1 through 3, note the reduced air in-leakage post-outage shown in November 2011 (Figure 1), based the data historian for the RheoVac system, the much improved cleanliness factor (Figure 2), and, most importantly, the vacuum conditions inside the condenser returned to values close to the original design (Figure 3). The excellent work performed by the plant staff produced a plant heat rate improvement of nearly 200 Btu/kWh (Figure 4).
 |
| 4. Trust the data. The plant heat rate improved little after a short outage was taken to clean the condenser in late May 2011. By fixing a long list of condenser system vacuum leaks, air in-leakage was stopped and the condenser vacuum returned to near-design conditions. The impact on the plant heat rate was significant. Source: Nalco Co. |
Today, the plant’s staff trust the RheoVac data and even use historian data on condenser performance to plan the next outage. Also, having real-time air in-leakage data available allowed the plant to confirm that the money spent on repairs had an immediate, positive impact on the plant’s bottom line.
Case Study 2: Vacuum Pump Seal Water Temperature
The second case study involves a southestern utility’s 2,000-MW-class multiple-power-block combined cycle plant. The second unit at this plant, commissioned about a decade ago, is a 2 x 1 power block configuration producing around 500 MW. Steam, produced by two triple-pressure heat recovery steam generators from the exhaust heat of the combustion turbines, is sent to a steam turbine. The exhaust steam from the steam turbine enters a two-pass, single-pressure condenser, which uses once-through cooling water from a large pond. The pond water is very high in alkalinity, phosphate, and hardness, which obviously increases the potential for mineral scaling throughout the plant’s heat exchangers. The summer pond temperatures can rise to 92F and higher, which increases the potential for scale formation.
Air removal from the condenser is by means of a vacuum pump system, as is true for virtually all combined cycle plants. These particular units use a plate-and-frame heat exchanger to cool the seal water prior to its entering the actual vacuum pump unit. Vacuum pumps rely on seal water to maintain the seal between the body and the rotor that actually draws the vacuum on the condenser. The seal water temperature is extremely important: If its temperature ventures above the saturation temperature at the condenser pressure, then the seal water will flash, the seal is lost, and the pump will no longer be able to draw a vacuum. (See “Condenser Backpressure High? Check Vacuum System Sizing” in the February 2012 issue or the POWERarchives at https://www.powermag.com.)
The seal water is actually condensate that is formed during the air removal process. As the steam/water stream from the condenser is brought from a vacuum to atmospheric pressure, a wet air mixture is sent to a knockout tank, where the air exits via the exhaust and the condensate is captured at the bottom of the knockout tank. This condensate is reused as seal water for the vacuum pump. Any extra condensate formation is dumped to drain. As the condensate is circulated through the vacuum pump, it is sent to a plate-and-frame heat exchanger, where cooling water is used to keep the seal water temperature under control.
If the cooling water chemistry is not properly controlled, fouling and scaling can occur in the plate-and-frame heat exchanger. If this happens, the ability of the heat exchanger to cool the seal water is much reduced, which in turn means the seal water temperature will rise above the saturation temperature of the operating condenser’s vacuum, the liquid seal will be lost, and the condenser vacuum will quickly be lost. If the condenser vacuum rises too high, the steam turbine, and potentially the entire plant, must be taken off-line.
Given the importance of the seal water temperature to reliable plant operation, you would think that online monitoring of that temperature and logging by the plant historian would be mandatory. However, it’s my experience that very few plants actually monitor seal water temperature. Recent events experienced by the plant staff affirmed their decision to digitally monitor and log data in a plant historian, again OSIsoft’s PI system. Online air in-leakage monitoring is not currently available at this plant, so a real-time comparison between air removal and seal water temperature was not possible.
Prior to May 7, 2011, the seal water temperature had risen to over 130F (Figure 5), high enough that the plant staff was concerned that the steam turbine would trip off line (Figure 6). At the time, the pond water was approximately 85F. In the past, the typical approach temperature was about 4F to 5F, so the expected seal water temperature was about 90F.
 |
| 5. Rising temperature. The vacuum pump seal water temperature prior to May 7, 2011, was extremely high, threatening continued plant operation. Cleaning the seal water heat exchanger returned the seal water to its expected temperature levels. Source: Nalco Co. |
 |
| 6. Loss of vacuum. The high seal water temperature reduced the effectiveness of the vacuum pump, which allowed the pressure inside the condenser to rise to the point where a steam turbine trip was imminent. After May 7, 2011, a return to the design seal water temperature allowed the vacuum pump to produce the design vacuum in the condenser. Source: Nalco Co. |
Given the plant’s prior experience with the vacuum pump heat exchangers, the decision was made to acid clean the exchangers in the hope that the seal water temperature would then decrease. The heat exchanger cleaning was successful, and the effect was an immediate reduction of the seal water temperature and, therefore, improved vacuum conditions inside the condenser.
The seal water temperature did not suddenly increase; instead, it rose gradually, beginning late the previous year (Figure 7). The plant did not have a consistent condenser performance-monitoring protocol in place at that time, so the temperature rise was not spotted until the steam turbine backpressure began to rise. Digitally monitoring the seal water temperature would have allowed the plant to schedule a heat exchanger cleaning during a routine planned outage rather than handling the problem as an emergency.
 |
| 7. Spotting trends. The plant staff was unaware of the slow seal water temperature rise until the steam turbine backpressure rise threatened to trip the steam turbine. Vacuum pump seal water temperature is important plant data that should be closely monitored. Source: Nalco Co. |
As a result of this incident, the plant staff developed an appreciation for the importance of condenser performance monitoring and, specifically, the critical importance of seal water temperature measurement and logging for trend analysis.
Because this particular cooling water is so difficult to control without anti-scalant, the plant is now considering use of an anti-scalant for all cooling systems. An anti-scalant, combined with continued monitoring of the seal water temperature and other important condenser parameters, should eliminate a reoccurrence of this problem in the future.
Case Study 3: Cooling Tower Fill Weight
A plant with twin 150-MW-class coal-fired units located in the eastern U.S. is the subject of the third case study. Each unit has a two-pass, single-pressure condenser that is cooled via a recirculating, evaporative cooling tower.
What is interesting about this case study is that the plant designers had the foresight to install an automated cooling tower fill weight monitor. Its function is to monitor in real time the weight of a small section of the fill. The data is then sent to the plant distributed control system (DCS), where it is displayed and captured by the plant historian, again PI.
Cooling tower fill is a material with labyrinth-like packing that is added to the tower to increase the contact surface and contact time between the water and air to improve its heat transfer efficiency. An increase in fill weight is a measure of the amount of fouling that has occurred in the tower. However, even a simple system requires a section of fill that can be manually removed and weighed on a periodic basis. Because fill weight correlates with fill fouling, this information is invaluable when designing a cooling system’s biocide, scale inhibition, and fouling inhibition programs. And because cooling towers are designed with a specific liquid-to-gas ratio, the fill weight, and thus fouling, will directly correlate with the overall cooling tower efficiency.
The plant experienced significant biofouling in the past, which caused an increase in the cold water temperature of the cooling tower and elevated the steam turbine exhaust pressure as well. Exacerbating the problem is the plant’s heavily cycling operating profile, which makes an effective biocide program to reduce cooling tower fouling very difficult to maintain.
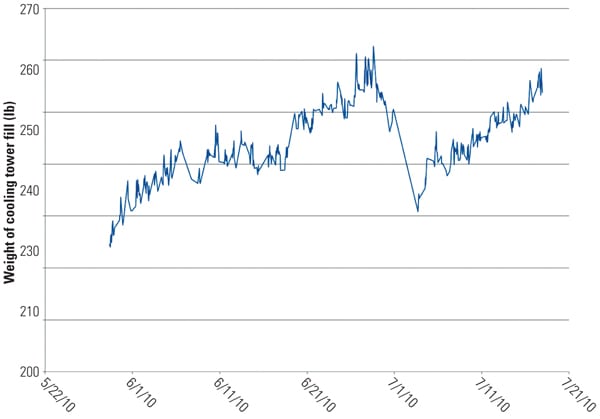
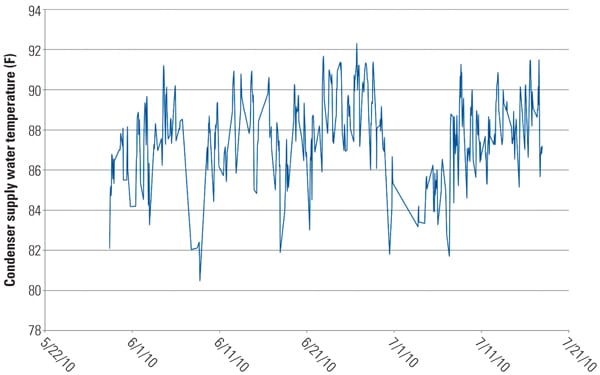
The plant experimented with a new biocide program during the summer of 2010. In mid-July, a biocide was slug fed to determine what benefit, if any, was possible. Shortly after feeding the product on June 28, staff saw a significant reduction in tower fill weight (Figure 8). Concurrently, they observed an appreciable 5F decrease in cooling tower basin temperature (Figure 9), which equates to an improvement in condenser vacuum of about 0.5 HgA (Figure 10). Finally, as seen in the figures, the biocide experiment was a one-time shot; soon after, the pressure in the condenser again began to rise.
 |
||||
8. Weighty fill. Biofouling of a cooling tower increases the weight of the tower fill. Injecting a single slug of biocide temporarily decreased the biofouling, although it soon returned. Source: Nalco Co.
The conclusion drawn from the data is that the cooling tower was significantly fouled, whereas the condenser was not. This observation confirms our field experience that many condenser performance issues are actually cooling tower performance issues. By instrumenting the cooling tower appropriately—that is, measuring cooling water flow, airflow for each cell, and other atmospheric monitoring in accordance with Cooling Technology Institute guidelines—accurate troubleshooting can be performed. The Bottom LineIn each of these condenser performance case studies, the plant used a condenser-monitoring system that collected digital data that was fed to the plant historian to quickly diagnose problems so that rapid repairs can be made that will return the plant to normal operation. The cost to implement a condenser-monitoring system is often much less than the lost revenue and additional costs of a forced outage when unexpected problems appear. Thanks to AEP’s Angela Larrick and my colleagues Aaron Haines, Ellie Pallomo, and Loren Beard at Nalco Co. for their assistance in the preparation of this article. — Kevin Boudreaux (kjboudreaux@nalco.com) is a power industry technical consultant for Nalco Co.’s Power Group. |
https://www.powermag.com/improve-condenser-performance-through-better-instrumentation/?pagenum=5

