In a gas governor unit, gas pressure vibration often occurs in the tube that connects the diaphragm chamber of the pilot valve to the downstream pipeline. Generally, placing a restriction such as an orifice in the tube can curb the vibration. However, because of the nonlinear flow rate characteristics of an orifice, the gain of the pressure response changes with changing amplitude of the pressure vibration. This paper proposes a method that employs porous materials for improving the characteristics of the gas pressure control system on account of their linear flow rate characteristics. A static flow rate characteristics experiment was performed and the linear flow rate characteristics of the porous materials were confirmed. Then, a series of dynamic pressure response experiments, in which an isothermal chamber replaced the diaphragm chamber, were performed to examine the dynamic characteristics of the porous materials and an orifice. The experimental results revealed that the gain of the pressure response in the isothermal chamber with the porous materials remained unchanged irrespective of changes in the pressure vibration amplitude, and they were in close agreement with the simulation results. They also indicated that the pressure gain of porous materials is smaller than that of an orifice when the amplitude of pressure vibration is small. These results demonstrate that porous materials can be employed instead of an orifice in the gas governor unit in order to improve the unit’s stability.
Keywords:
Porous Materials, Pilot Valve, Linear, P-Q Characteristics, Dynamic Response
1. Introduction
Gas governor units are generally used in city gas pipelines to control the downstream pressure. Use of a pilot valve in a governor unit is an effective approach for reducing the offset of the pressure regulator for a medium- pressure gas pipeline [1] . The pilot valve contains a tube that connects its diaphragm chamber to the downstream pipeline, and this tube is used to detect the secondary pressure and provide feedback for adjusting the control pressure of the main valve. It is known that resonance occurs in an air column at its inherent frequency. Correspondingly, gas column vibration also occurs in the tube. In addition to this vibration, the secondary pressure often oscillates because of the dead-band [2] and the phenomenon of flow choking at the restrictions of the pressure-reducing elements [3] . Earney summarized that all the components in a given pressure system are contributing factors to any instability of the pressure control [4] . All these vibrations could affect the control pressure in the main valve, lead to secondary pressure instability, and generate valve noise. Feedback can amplify the vibration, which in turn would make the gas equipment unusable [5] .
These problems were studied in some previous works, including that of Zafer and Luecke [6] , who established a linearized model to study the stability of a gas regulator system with changes in various design parameters. Ng [7] reported that reduction of the acoustical energy at the source is the most direct approach for overcoming the valve noise problem; most quiet valves are based on the concept of reducing and redistributing acoustical energy by dividing the flow into several smaller streams. Generally, field modifications for stabilizing an installation include relocation of the pressure-sensing tap, redesign of the downstream piping to provide more volume, and restriction of the pressure feedback line [8] . A restriction such as an orifice or a needle valve is installed in the tube by the manufacturer in order to constitute a pneumatic RC circuit with the diaphragm chamber. This method is used to curb the effects of the downstream pressure vibration and has been employed in several previously patented pilot valves [9] - [11] . However, the pneumatic RC circuit, which uses an orifice as the restriction, also has some disadvantages. For example, because of the nonlinear flow rate characteristics of the orifice, the gain of the pressure response changes with changing amplitude of the pressure vibration [12] - [14] . On the other hand, the laminar flow in some microholes, pipes, and slits shows linear flow characteristics. Based on these characteristics, a laminar flow meter that uses laminar pipes was developed for unsteady flow rate measurement [15] . Recently, porous materials have attracted research attention because of its good porosity and permeability, and they are widely employed in various mechanical devices such as aerostatic bearings [16] , magnetorheological valves [17] , and household water filters [18] .
This paper proposes a method that employs porous materials for improving the characteristics of a gas pressure control system owing to their linear flow rate characteristics, which cause the flow state to change to laminar in the microholes. First, a static flow rate characteristics experiment was performed in order to compare the characteristics of porous materials with those of an orifice, and the linear flow rate characteristics of the porous materials were confirmed. Then, a series of dynamic pressure response experiments were performed to examine the dynamic characteristics of the porous materials and an orifice. Generally, temperature changes in the diaphragm chamber are small; therefore, they were neglected in this experiment. In addition, the simulation of an isothermal chamber model is easier than the implementation of a heat transfer model. Therefore, the diaphragm chamber was replaced with an isothermal chamber [19] in order to compare simulation results with experimental results. The experimental results were found to be in good agreement with the simulation results. The experimental results indicated that the gain of the pressure response in the isothermal chamber with porous materials remains unchanged regardless of changes in the pressure vibration amplitude and that the pressure gain of porous materials is smaller than that of an orifice when the amplitude of the pressure vibration is small. These results demonstrate that porous materials can be employed in place of an orifice in the gas governor unit and other gas pressure control systems in order to improve their stability.
2. Pilot Valve and Pneumatic RC Circuit
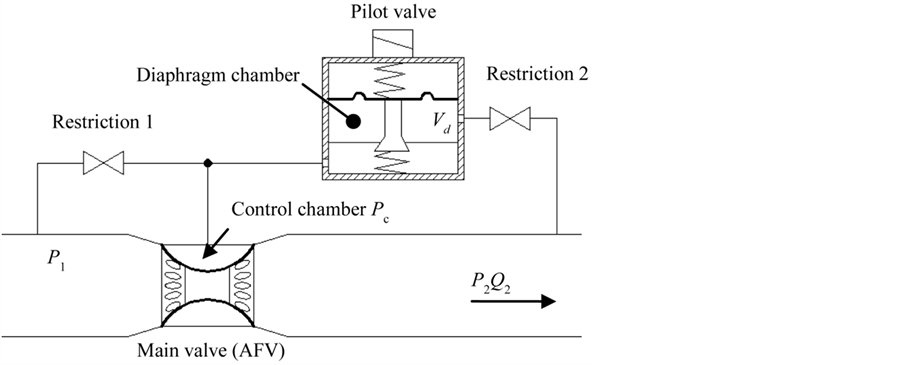
Gas governor units are classified into two types: direct-acting type and pilot type. Figure 1(a) shows a common pilot-type gas governor system. The main valve, termed the axial flow valve (AFV), is installed in the main pipeline, and the pressure Pc in its control chamber is regulated by the pilot valve, which is installed in the pilot line. When the flow demand increases, the downstream pressure P2 decreases. Then, the pressure Pd in the diaphragm chamber of the pilot valve drops through the tube, which is restricted by an orifice or some other restriction. As a result, the pilot valve opens by the adjustable spring force and allows the gas to flow into the pilot
 (a)
(a) (b)
(b)
Figure 1. Pilot-type governor system. (a) Pilot-type governor system; (b) Pneumatic RC circuit.
line. This flow leads to a drop in Pc and causes the main valve to open. Eventually, P2, Pd, and Pc achieve an equilibrium state by this feedback control system.
In this system, restriction 2 and the diaphragm chamber constitute a pneumatic RC circuit, as shown in Figure 1(b). The volume of the chamber is similar to the volume of the diaphragm chamber Vd. In the pneumatic RC circuit, as is the case in an electric RC circuit, the change in pressure Pd in the chamber is delayed from the downstream pressure P2 because of the integral of the flow rate. Therefore, if the restriction is stronger and the frequency of the pressure vibration is higher, the time delay will be larger. That is, the pressure gain will decrease with an increase in the frequency of the pressure vibration and the resistance of the restriction. However, the resistance characteristics of a pneumatic restriction such as an orifice are nonlinear, unlike the characteristics of electrical resistance.
3. Nonlinear and Linear Flow Rate Characteristics
The resistance characteristics of a pneumatic restriction refer to its flow rate characteristics. The relationship of the pressure with the flow rate G in an orifice is summarized in the well-known flow rate equation [20] :
 (1)
(1)
 (2)
(2)
where Se is the effective area, d is the diameter of the orifice, CD is the discharge coefficient, R is the gas constant, P1 is the upstream pressure, P2 is the downstream pressure, θ1 is the flow temperature, and κ is the specific heat ratio.
From this equation, it is easy to see the nonlinear relation between the pressure and the flow rate. Usually, a control system is expected to have linear flow rate characteristics in engineer problems. The advantage of linear flow rate characteristics is discussed in the next section. The linear flow rate characteristics of a laminar-flow pipe, which has a small inner diameter, can be determined from the Hagen-Poiseuille equation:
 (3)
(3)
where Q is the volumetric flow rate, r is the radius of the pipe, L is the length of the pipe, µ is the dynamic viscosity, and ΔP is the differential pressure.
However, this flow rate is extremely small, and several tens of thousands of pipes would be required to achieve a flow rate corresponding to a 1 mm orifice. It is difficult to manufacture such a large number of micropipes. Fortunately, porous materials produce the same effect as the micropipes, i.e., of converting the flow state to laminar. Figure 2 shows a porous material with a hollow cylindrical shape; its dimensions are labeled in this figure. The filter precision of the porous material is only 2 μm. The right figure shows the flow route in our experimental apparatus, wherein it can be seen that the effective flow area is the cylinder’s inner wall.
A static P-Q characteristics experiment performed to determine the actual flow rate characteristics of the porous material and the orifice. Figure 3 shows the schematic of the experimental setup. In this experiment, the gas was replaced with air because of their thermodynamic similarity, the upstream pressure was set to a constant

Figure 2. Specimen of porous material.
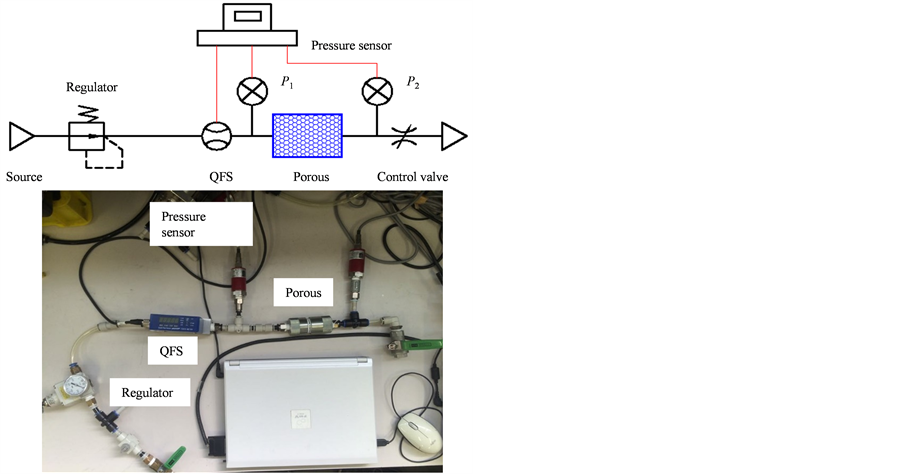
Figure 3. Schematic of experimental setup.
value by the regulator, and the downstream pressure was adjusted by the control valve. The pressures P1 and P2 and the flow quantity Q were recorded by a pressure sensor and quick flow sensor (QFS), respectively.
In the experiment, two orifices of different diameters (3.2 mm and 2.8 mm) were employed, for which the flow rate was almost the same as that for the hollow porous cylinder under a certain differential pressure. Figure 4 shows the P-Q characteristics curves of the porous material and the orifice. In the figure, the diamonds, circles, and squares indicate the experimental data for the porous material, 2.8 mm orifice, and 3.2 mm orifice, respectively. The negative signs of ΔP and Q represent reversed flow. It can be clearly seen that the trend of the experimental data for the porous material is a straight line and that for the orifice is a curve. The straight line in this figure is the linear fitting of the data points for the porous material. Furthermore, the calculated curves were obtained using Equation (1), for which purpose CD was obtained from the experimental data points of the orifice. The resultant equations of the line and curve were used in the simulation of the dynamic response described in the next section. The P-Q characteristics curve of the orifice indicates that the flow rate increases rapidly when the differential pressure is small and gradually reduces when the differential pressure increases. However, the porous material’s response remains unchanged because of its linear characteristics. That is, a small differential pressure change results in a large change in the flow rate through the orifice and generates a pressure oscillation in the chamber of the pneumatic RC circuit. Therefore, the amplitude of oscillation of the pressure P2 affects the dynamic response of the pressure Pd in the chamber with the orifice, but it does not affect the dynamic response of Pd in the chamber with the porous material.
4. Simulation of Dynamic Response
The dynamic responses of a pneumatic RC circuit with a porous material and of a pneumatic RC circuit with an orifice were simulated by MATLAB. The pressure vibration source P2 was replaced with a pressure sine signal, and the chamber model was replaced with an isothermal chamber model.
First, the restriction models of the porous material and orifice were obtained from their P-Q characteristics curves. From Figure 4, the discharge coefficient CD was calculated to be 0.98 for the 3.2 mm orifice and 0.93 for the 2.8 mm orifice using model given by Equation (1). The fitted equation of the P-Q characteristics curve for the porous material was determined to be
 (4)
(4)
where Qporous is the flow quantity in the porous cylinder. The units of pressure and flow rate were kPa and L/min, respectively. The mass flow rate can be obtained by a conversion of units.
Second, for the isothermal chamber, the ideal gas equation was differentiated with respect to time:
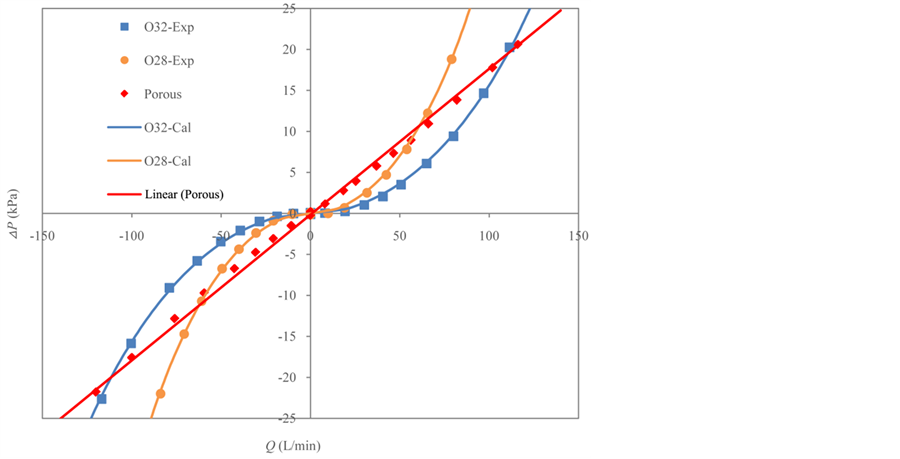
Figure 4. P-Q characteristics curves.
 (5)
(5)
 (6)
(6)
where Pd is the pressure in the chamber, V is the volume, m is the mass of air in the chamber, θ is the temperature, and R is the ideal gas constant. Because the chamber is isothermal, . Furthermore,
  , where G is the mass flow rate. Therefore, Equation (6) was changed to
 (7)
(7)
Figure 5 shows the simulation block diagram.
5. Dynamic Response Experiment
A frequency response experiment was performed to investigate the dynamic responses of porous materials and orifices with various input amplitudes. In our experiment, a sine pressure generator was used to provide the pressure input by regulating the inflow and outflow from a servo valve by using feedback proportional-integral (PI) control. Figure 6 shows the pneumatic circuit of the frequency response experiment; the pressure generator is in the block bounded by the red dotted lines. The generated pressure was recorded by pressure sensor P2. The response pressure in isothermal chamber 1 (ITC 1) was recorded by pressure sensor Pd. Figure 7 shows a photograph of this experimental setup. Table 1 presents the primary specifications of the experimental equipment.

Figure 5. Simulation block diagram.
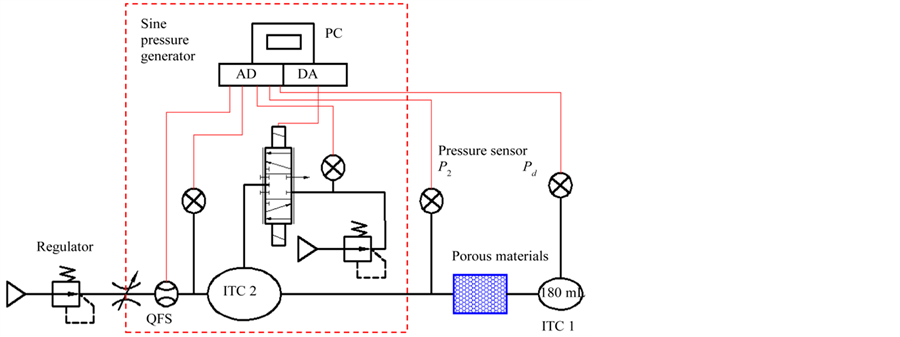
Figure 6. Pneumatic circuit diagram of frequency response experiment.
Table 1. Specifications of experimental equipment.
The experimental conditions are listed in Table 2. First, the amplitude of the generated pressure P2 was set to a constant value of 1 Hz, and the data of P2 and Pd were recorded. Then, a data were recorded every 5 Hz with increasing frequency. The amplitude was then changed and the above steps were repeated. After the completion of a restriction test, the restriction was changed and the procedure returned to the first step. Finally, the data were processed by harmonic analysis using fast Fourier transform (FFT) to confirm the accuracy of the amplitude and phase.
Figure 8 shows the pressure response with the porous material at 25 Hz when the amplitude of P2 is 10 kPa. The amplitude of Pd was almost a third of P2, and the gain of Pd was calculated to be −10.07 dB, the phase difference was −72.31˚.
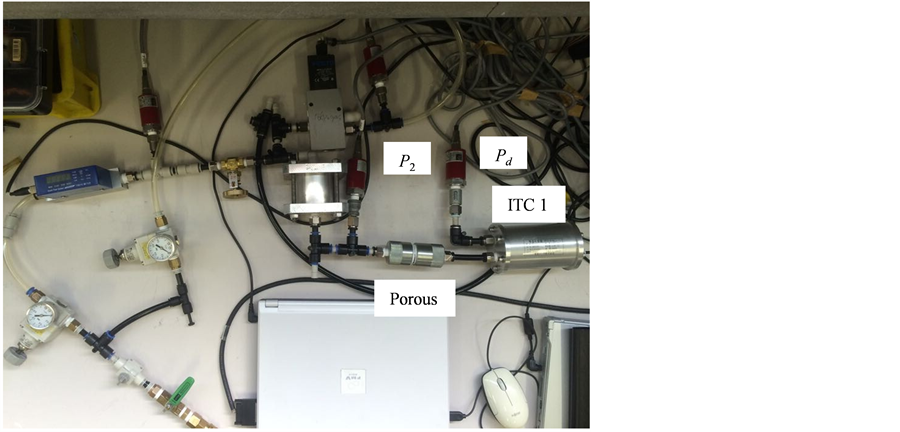
Figure 7. Photograph of setup of frequency response experiment.
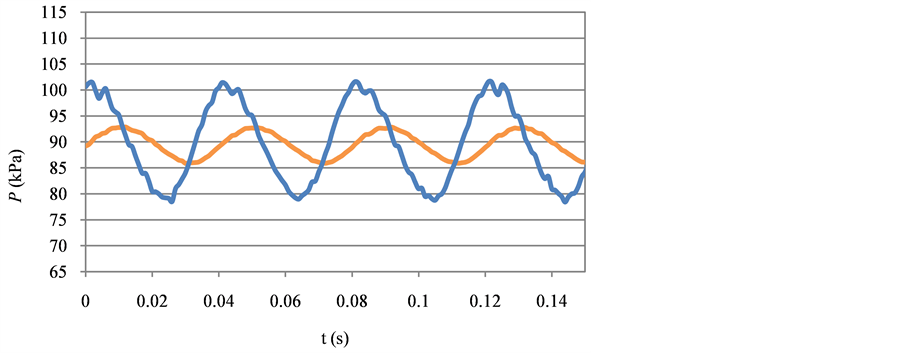
Figure 8. Pressure response with porous material in time domain (f = 25 Hz, amplitude = 10 kPa).
Table 2. Experimental conditions.
Figure 9 shows the frequency response of the porous material, and Figure 10 shows that of the orifices. In these figures, the points represent the experimental data and the markers represent the different amplitude conditions of the input pressure. The solid curves represent the simulation results. In addition, the top graph shows the gain changes, and the bottom graph shows the phase changes.
The results show that the pressure gain drops and the phase delay increases with increasing frequency irrespective of what the restriction is. In the simulation, the magnitude of the gain drop in the porous restriction is invariable with respect to the amplitude of the input pressure. Therefore, the simulation results form only one curve in Figure 9. Furthermore, the experimental data are in agreement with the simulation results when the input pressure amplitudes are 5, 10, and 20 kPa. Thus, these points are all located on nearly the same curve. However, the pressure gain curve of the orifices drops at a different rate when the amplitude of the input pressure changes, as shown in Figure 10. It is obvious that the data points are distributed on these curves according to the different input amplitudes. The reason for this is thought to be the linear and nonlinear characteristics of the porous materials and orifices, respectively. Because of the linear P-Q characteristics of the porous restriction, the quantity of flow into the chamber will increase in proportion to the differential pressure. If the amplitude of the input pressure changes, the flow rate changes by the same proportion, and the amplitude of the pressure response Pd also changes by the same proportion. However, in an orifice, these changes cannot remain proportional owing to its nonlinear flow rate characteristics. In short, the flow rate resistance is constant in a porous material but not in an orifice. This phenomenon can also be evidenced in the change in the phase difference. The phase difference obtained in the simulation was about 10˚ larger than that obtained in the experiment at a high frequency such as 40 Hz. The reason for this was thought to be that the sample time, which was set to 1 ms in the dynamic response experiment, was perhaps too long. When the frequency is too high, for example, the period of the pressure sine wave is only 0.025 ms at 40 Hz. Therefore, since a period has only 25 points, the error of the phase difference calculation becomes large.
In addition, for comparison purposes, the frequency response of the porous material was also determined, as represented by the dashed curve in Figure 10. The comparison shows that the pressure gain for the porous material
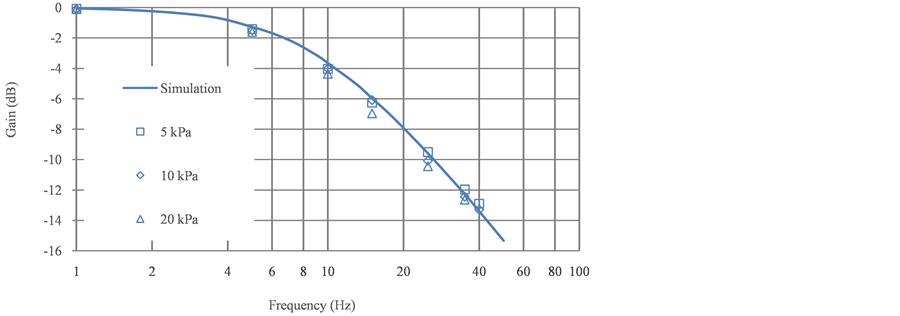
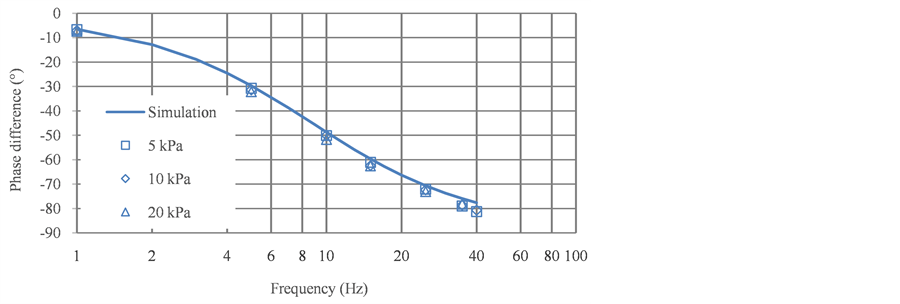
Figure 9. Frequency response of porous material.


 d = 2.8 mm d = 3.2 mm
Figure 10. Frequency response of orifices.

